
The Daily Sales Summary page is one of the most common reports in the system, as it provides an at-a-glance view of your restaurant's weekly financial data. The page also offers additional reports available on the top toolbar. All reports offered through the Daily Sales Summary is generated from historical sales (sales after the closeout is ran). Many of the reports offered in this section are also available on the main Reports Menu in the Sales History section.
Common Uses for the Daily Sales Summary:
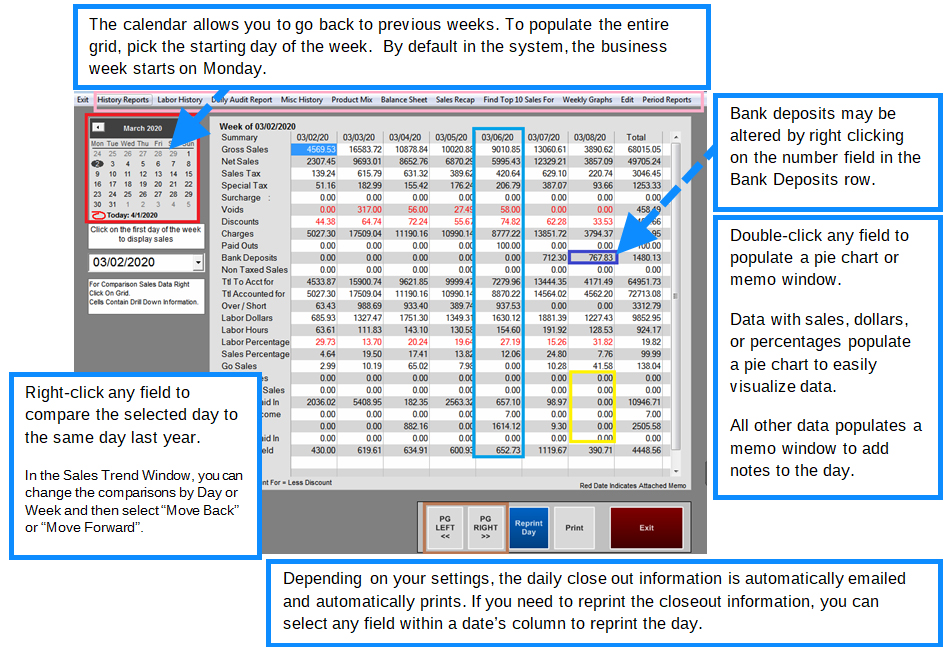
- Viewing sales data for the day/week quickly
- Accessing history reports on the tool bar
- Editing daily deposits
- Viewing the weather for the day or past days (including written memos)
- Accessing sales trends
- Reprinting the daily close out
- Reclosing the day
- Resending (reposting) sales to the cloud
For a 0.00 column without a date, it means either the daily close has not yet ran, or that the restaurant was closed and a daily close out was not necessary.
Sales Summaries Reports at a glance
(available reports on the Daily Sales Summary toolbar)
All reports in this section are generated from closed sales (historical data).
History Reports:Provides various reports such as sales summary, tender types used, sales by department or category, weekly sales, and sales by meal period.
Labor History: Useful to quickly see labor hours for the day; this will only show the labor by department (or job code) such as Manager, Cook, Cashier, Server.
Daily Audit Report: The Daily Audit Report is the most commonly used report in MicroSale. It is a daily breakdown of a day’s sales by various areas. The report allows management and operators to analyze a daily recap of sales with comparisons to last year, labor, and forms of payment in a quick snapshot view.
Misc History: Provides detailed information for sales accrued by Tender Type, when Discounts and Voids are being applied and when Paid Outs are used for supplies.
Product Mix: Duplicate report from Menu and Menu Sales (please refer to section on Menu Item and Sales)
Balance Sheet: Used to balance your products sold to payments collected. Used for a single day or date range.
Sales Recap: This report is useful when you want to view sales by department for a closed day or range of days.
Find Top 10 Sales: The Top 10 Sales Report is a useful way to view your top or bottom grossing sales for the past two years (approximately 730 days by default)
Weekly Graphs: The reports are useful when you would like to see a visual breakdown of your sales numbers compared by day for the week.
Edit (Sales): Allows you to reclose or edit closed day’s sales information.
Period Reports: MicroSale automatically makes a 13-period calendar. Depending on when you start your week (for example many restaurants start on Monday rather than Sunday), that first day in January is the start of the 13-period cycle and increments exactly 4 weeks.